Yesterday,
the Dow Jones opened lower and finished the day negative following another hot US CPI report.
This has pushed rate cuts expectations further out with the market now pricing
in less rate cuts than the Fed’s dot plot. The Treasury yields skyrocketed
across the board putting some pressure on the stock market. Now the market
might even think that the economy is still doing great, and the Fed is not
going to hike anyway, but there are now good reasons to see a bigger correction
to the downside, so the bulls should be extra careful.
Dow Jones Technical
Analysis – Daily Timeframe
Dow Jones Daily
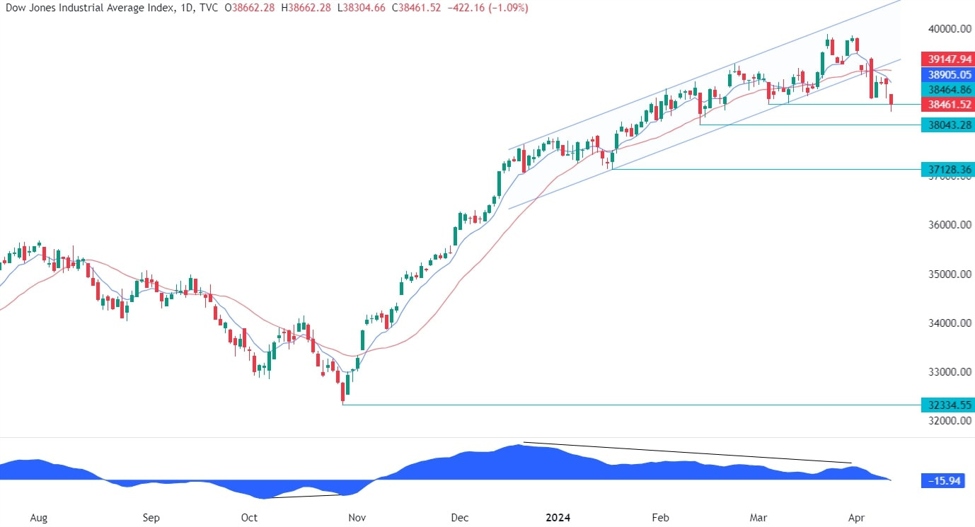
On the daily chart, we can see that the Dow Jones has
been trading inside a rising channel and continued to diverge with the
MACD for a
long time. This is generally a sign of weakening momentum often followed by
pullbacks or reversals. Recently, we got a breakout which opened the door for a
bigger correction into the 37128 level. The price bounced on the first support level at
38464 following the goldilocks NFP, but fell back to it following another hot
CPI report.
Dow Jones Technical
Analysis – 4 hour Timeframe
Dow Jones 4 hour
On the 4 hour chart, we can see that
the price bounced on the first support level but got rejected by the downward trendline and
the blue 8 moving average before
breaking below the support following the CPI release. The sellers will now have
even more conviction to sell the rallies and we can expect a drop into the
second level at 38043 next. The buyers, on the other hand, will want to see the
price breaking above the trendline to invalidate the bearish setup and position
for a rally back into the highs.
Dow Jones Technical
Analysis – 1 hour Timeframe
Dow Jones 1 hour
On the 1 hour chart, we can see more
closely the downward trendline where we can also find the confluence of the
red 21 moving average and the 38.2{721fc769be108e463fe4e33f629fb22fe291c423a7a69eaaf65dcb28e9b05dea} Fibonacci
retracement level. This is where we can expect the
sellers to step in with a defined risk above the trendline to position for a continuation
of the downtrend with a better risk to reward ratio. The buyers, on the other
hand, will want to see the price breaking higher to start targeting new highs.
Upcoming Events
Today we get the US PPI report and the latest US
Jobless Claims figures. Tomorrow, we conclude the week with the University of
Michigan Consumer Sentiment survey.


